Lesson 16. Operational Visibility
Mission link: This is stage 9's capstone. Lesson 15 covered the cost of talking to Redis over the network; this lesson is seeing what's actually happening inside the instance itself, and the specific command every one of these tools exists partly to help avoid ever needing to reach for.
Primary source: Docs: "Key eviction", Redis
Prerequisites: Lesson 15, Eviction policy
Warm-up
- ▢ Why doesn't pipelining a batch of commands guarantee no other client's command interleaves with them?
Check
Pipelining only batches how commands are sent and their responses read back over the network; Redis still processes each pipelined command as its own individual operation, so another client's command can run between any two of them unless the batch is also wrapped in MULTI/EXEC.
- ▢ What two separate costs do pipelining and connection pooling each address?
Check
Pipelining reduces the number of round trips a batch of commands costs. Connection pooling reduces how often the cost of establishing a connection is paid at all, by reusing already-established connections instead of opening a new one per command.
Know this
INFO: the first thing to check, a broad snapshot in one call
INFO returns a categorized snapshot of the instance's own state: memory usage and fragmentation, replication status and lag, connected clients, keyspace statistics, and more, all in one response. It's the right first move when diagnosing almost anything, since it surfaces the broad shape of a problem (memory pressure, an unexpected replication state, an unusual client count) before narrowing in with a more targeted tool.
SLOWLOG: the specific command that's actually slow
SLOWLOG GET returns a ring buffer of the most recent commands that took longer than a configured threshold (slowlog-log-slower-than, in microseconds) to execute, each entry naming the command, its arguments, and exactly how long it took. Since Redis is single-threaded (lesson 14), one genuinely slow command blocks every other client for its entire duration; SLOWLOG is the tool for finding that specific command after the fact, rather than guessing at what might have caused a stall from INFO's broader numbers alone.
The latency monitor: distinguishing a slow command from something else entirely
LATENCY HISTORY and LATENCY LATEST track latency spikes by event class, not just command execution: a slow command shows up as one class, but so does a fork (the process-duplication step behind an RDB snapshot, the same OS-level mechanism data/postgres covers for its own persistence model), an expire cycle running long, or other internal operations that can stall the event loop without being a "slow command" SLOWLOG would catch at all. This distinction matters directly: a latency spike traced to a fork event needs a different fix (adjusting persistence settings) than one traced to an actual slow command (fixing or removing that command).
MEMORY USAGE and finding an unexpectedly large key
MEMORY USAGE key reports exactly how many bytes a specific key currently consumes, the tool for confirming a suspicion that one particular key has grown far larger than expected (a hash that was supposed to stay small, a list that was never trimmed). Checking every key this way one at a time doesn't scale to a large keyspace; redis-cli --bigkeys samples the keyspace to estimate the largest keys per data type without needing to check every single one individually, a practical middle ground between "check one key I already suspect" and "check literally everything."
SCAN versus KEYS: the same question, one of which can take the server down
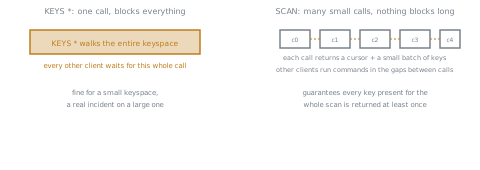
KEYS pattern returns every matching key in the entire keyspace, computed in a single call; because Redis is single-threaded, that one call blocks every other client for however long it takes to walk the whole keyspace, which can be seconds or longer on a large database, effectively freezing the instance for everyone else the entire time. SCAN cursor instead returns a small batch of keys plus a cursor to continue from, incrementally, letting other clients' commands run in the gaps between successive SCAN calls rather than blocking behind one giant one. SCAN's actual guarantee is precise, not "perfectly consistent": a full iteration is guaranteed to return every key that was present for the entire duration of the scan at least once, but may return a key more than once, and makes no promise about a key added or removed partway through. Running KEYS * against a large production keyspace, rather than SCAN, is one of the most common, avoidable causes of a Redis instance appearing to freeze.
Practice
- ▢ A team notices intermittent latency spikes but
SLOWLOGshows nothing unusual, no command is taking longer than the configured threshold. What tool should they check next, and what kind of cause might it reveal thatSLOWLOGwouldn't?
Hint
Consider what kind of stall isn't actually a single command taking too long to execute.
Check
The latency monitor (LATENCY HISTORY/LATENCY LATEST), which tracks latency by event class rather than only command execution time. It could reveal a stall from something like a fork for an RDB snapshot or a long-running expire cycle, neither of which is a "slow command" SLOWLOG would ever catch, since SLOWLOG only records commands that individually exceed its threshold.
- ▢ A hash that was expected to stay small has grown unexpectedly. Which command confirms exactly how much memory it's actually using, and why is checking every key in the database this way impractical at scale?
Check
MEMORY USAGE key, applied to that specific key, reports its exact byte size. Checking every key in a large database this way one at a time doesn't scale; redis-cli --bigkeys (a sampling-based scan) is the practical alternative for finding unexpectedly large keys without checking every single one individually.
- ▢ An operator runs
KEYS user:*against a production instance holding 20 million keys, expecting a quick result. What actually happens to every other client connected to that instance while this runs?
Check
Every other client is blocked for the entire duration of the KEYS call, since Redis is single-threaded and KEYS computes its full result (walking the entire keyspace) as one uninterruptible operation before returning anything. On a database this size, that block can last long enough to look like an outage to every other connected client.
- ▢ Rewrite the
KEYS user:*operation above usingSCANinstead, and explain specifically what changes about its effect on other clients.
Check
SCAN 0 MATCH user:* COUNT 100, repeated with each returned cursor until a cursor of 0 is returned again, accumulating matching keys across calls. Each individual SCAN call only processes a small batch, so other clients' commands can run in the gaps between successive calls, rather than everyone being blocked for the entire operation's duration the way a single KEYS call blocks them.
-
▢ Which claim correctly describes
SCAN's actual guarantee, precisely?- a)
SCANguarantees an exact, unchanging snapshot of the keyspace, identical to whatKEYSwould return - b) A full
SCANiteration is guaranteed to return every key present for the entire duration of the scan at least once, may return some keys more than once, and makes no guarantee about keys added or removed partway through - c)
SCANblocks the server the same wayKEYSdoes, just spread across more calls - d)
SLOWLOGand the latency monitor track exactly the same thing, just with different command names
- a)
Check
b) That's SCAN's exact, documented guarantee, weaker than a perfect snapshot but still precise. (a) is false: SCAN explicitly doesn't guarantee this, unlike KEYS's single-pass consistency. (c) is false: the whole point of SCAN is that each individual call is small and non-blocking, unlike KEYS's single long block. (d) is false: SLOWLOG only tracks command execution time past a threshold; the latency monitor tracks a broader set of event classes, including non-command stalls like fork.
Real-world reps
- [ ] On a Redis instance you can access, run
INFO,SLOWLOG GET 10, andredis-cli --bigkeys, and note anything each one surfaces that the others don't. - [ ] Search a codebase you have access to for any use of
KEYSagainst a Redis instance in application code (not an interactive debugging session), and check whether it should beSCANinstead. - [ ] Tomorrow: read the primary source's guidance on
SCAN's consistency guarantees in full, and write down, in your own words, the specific scenario (a key added mid-scan) it explicitly does and doesn't promise to handle.
Going further
Not landing? Reread the primary source at the top, since this lesson compresses it and compression is where understanding leaks. Check the glossary for any term that felt slippery.
If the lesson itself is unclear rather than the material, that is a defect: open an issue.