Lesson 16. p99 Latency Measurement Methodology
Mission link: This workspace's mission is to defend a p99 latency budget, and a defended number has to come from a measurement done right; this lesson is what "done right" means before lesson 17 ties that number back to every earlier choice.
Primary source: Docs: vLLM Documentation, vLLM Project
Prerequisites: Lesson 15, KV cache
Warm-up
- ▢ Why does prefill claim most of a request's eventual cache footprint in one step, while decode adds the rest gradually?
Check
Prefill processes the entire prompt in one forward pass, computing and caching every prompt token's keys and values together. Decode generates one output token per step, so the cache grows by only one token's worth per step.
- ▢ In continuous batching, what causes one large admitted request to stall every other sequence sharing its batch step?
Check
A batch step is atomic: every sequence sharing it advances together, so a large prefill folded into one step delays every other sequence's next token until that step finishes. This is head-of-line blocking.
Know this
Why p99, not the average
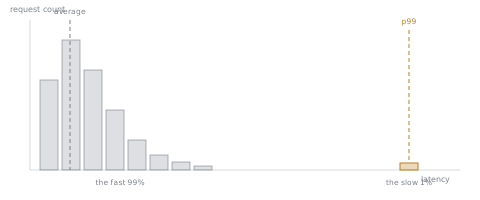
The p99 of a latency distribution is the value below which 99% of measured requests fall; only the worst 1% are slower. An average can look fine while hiding a real problem: lesson 5's head-of-line blocking, for instance, only strikes the small fraction of requests unlucky enough to share a step with a large prefill, so it barely moves an average across thousands of otherwise-fast requests, while it can make that unlucky 1% dramatically slower. A latency budget defended by an average would miss exactly the failure mode this workspace spent stage 2 explaining.
Which latency, measured separately
"Request latency" is not one number for an LLM server; at minimum it splits into time to first token (TTFT), dominated by prefill, and inter-token latency (ITL), sometimes called time per output token, dominated by decode. These behave differently (lesson 3) and are shaped by different levers (batching and scheduling for TTFT, batch size and quantization for ITL), so folding them into one blended number obscures which lever a bad p99 actually points at. A budget worth defending names p99 TTFT and p99 ITL (or the p99 of total end-to-end latency, when that is genuinely what the workload cares about) as separate figures, not one average of two different things.
What makes a p99 measurement trustworthy
A p99 is an estimate of a rare event, by definition only the worst 1% of a sample, so it needs enough samples to mean anything: a p99 computed from 20 requests is really reporting on a single request (the 1st percentile-worst of 20 is close to the maximum, not a stable tail estimate), while a stable estimate typically needs samples in the hundreds to thousands. The load generating those samples also has to look like the real workload: realistic concurrency (not so low that batching and scheduling behavior never actually gets stressed) and a realistic mix of prompt and output lengths (lesson 4's static-batching waste and lesson 5's head-of-line blocking both depend on request-length variance that a benchmark with uniform-length requests would never surface). A p99 measured under an unrealistic load is a real number about a workload that isn't the one being served.
Practice
- ▢ A server's average request latency looks fine, but users occasionally report requests that take far longer than expected. What does this pattern suggest about where the problem would show up in the latency distribution, and why might the average not have caught it?
Check
It suggests a tail problem, something like lesson 5's head-of-line blocking, that only affects a small fraction of requests. An average across many mostly-unaffected requests barely moves even when that small fraction gets dramatically slower, which is exactly why a p99 (or a similarly high percentile) is needed to see it at all.
- ▢ Why should TTFT and inter-token latency be measured and reported as separate p99 figures, rather than folded into one "average request latency" number?
Check
TTFT is dominated by prefill and shaped by scheduling and chunking; inter-token latency is dominated by decode and shaped by batch size and quantization. A single blended number can't say which of those levers a bad result actually points at, and improving one can move a blended average without revealing whether the other got worse.
- ▢ A team computes a p99 latency figure from 20 measured requests. Is that figure trustworthy? Why or why not?
Hint
Think about how many of those 20 requests the 99th percentile is actually describing.
Check
No, not reliably. With only 20 samples, the 99th percentile is close to reporting on the single slowest request in the sample, not a stable estimate of a genuine tail. A trustworthy p99 needs a much larger sample, typically hundreds to thousands of requests, to average out noise from which particular requests happened to land in that top 1%.
- ▢ A benchmark measures p99 latency using requests that all have the same, uniform prompt and output length. Why might this understate the p99 a production workload with varied request lengths would actually see?
Check
Lesson 4 and lesson 5 both showed that variance in request length is what creates the failure modes that hurt tail latency: static-batching waste scales with the spread between requests' lengths, and head-of-line blocking is triggered by an unusually large prefill arriving among smaller ones. A uniform-length benchmark never produces that variance, so it never exercises the conditions the real workload's tail latency actually comes from.
-
▢ Which claim is true of a defensible p99 latency measurement?
- a) A single benchmark run of any size is sufficient, as long as it reports a p99 figure
- b) It should be measured with realistic concurrency and request-length variance, and reported separately for TTFT and inter-token latency
- c) The average and the p99 always move together, so measuring one is enough
- d) p99 only matters for CPU/edge serving, not GPU serving
Check
b) Both the realism of the load and the separation of TTFT from inter-token latency are necessary for the number to point at anything actionable. (a) is false: too few samples make a p99 unstable, as question 3 showed. (c) is false: an average can hide exactly the tail behavior a p99 exists to catch. (d) is false: tail latency and its measurement matter for any serving stack, GPU or CPU.
Real-world reps
- [ ] Find your serving stack's benchmarking tool (vLLM ships
benchmark_serving.py) and read what percentiles it reports by default and what request-length distribution it uses. - [ ] For a workload you have in mind, write down what a realistic prompt/output length distribution would look like, and whether a benchmark using uniform lengths would miss anything about it.
- [ ] Tomorrow: if you have a running server, run a benchmark against it with at least a few hundred requests and note the reported p99 TTFT and p99 inter-token latency separately.
Going further
- Docs: vLLM Documentation, vLLM Project
- Article: "How continuous batching enables 23x throughput in LLM inference while reducing p50 latency", Anyscale
- Resources
Not landing? Reread the primary source at the top, since this lesson compresses it and compression is where understanding leaks. Check the glossary for any term that felt slippery.
If the lesson itself is unclear rather than the material, that is a defect: open an issue.