Lesson 38. The Allocation That Never Happened
Mission link: Owning a Java service means you cannot eyeball whether a hot method allocates: the compiler may have already deleted the object entirely, or one careless line may have put it back, and only measurement tells you which.
Primary source: HotSpot Virtual Machine Garbage Collection Tuning Guide, Release 25
Prerequisites: Lesson 37, Lesson 14
Warm-up
- ▢ Lesson 37 measured a
record Point(int x, int y)at 24 bytes per allocation with default object headers. A method creates aPoint, reads its two fields to compute a sum, and returns only theint. ThePointreference never leaves the method. Does calling that method definitely cost 24 bytes of allocation, every time?
Check
Not necessarily. If the compiler can prove that nothing outside the method ever sees the Point reference, it can keep x and y as two separate values and never build the object at all: no header, no 24 bytes, no allocation to later trace or collect. This is escape analysis followed by scalar replacement, and it is the subject of this lesson. Whether it actually happens on a given run is a fact about the compiler's decisions, not about the source code alone, which is why the honest answer to "does it allocate" is "measure it" rather than "read it".
Know this
Cheap to hand out, not cheap to have created
"Allocation in Java is cheap" is a claim that is half true, and the half that is true is worth taking seriously rather than waving away. A young generation is allocated from with a bump-the-pointer scheme, and each thread gets its own thread-local allocation buffer, a private slice of that space it can hand out from without asking any other thread's permission. The common case for new is therefore genuinely a pointer bump: add the object's size to a thread-local cursor, hand back the address the cursor used to point at, and move on. No lock, no compare-and-swap, no coordination with any other thread. Measured against almost anything else a program does, that is fast.
The half that is not true is the implicit claim that follows: that because handing out the memory is cheap, the allocation itself is free. It is not. Every object a thread allocates is an object that now exists on the heap, and existing on the heap means some later collection has to deal with it: trace it to decide whether anything still reachable points to it, or copy it out of a young region that is about to be reused. A pointer bump is the cheapest possible way to create a liability; it is still a liability. The cost of an allocation is not paid at the new, mostly. It is paid later, in proportion to how much garbage a collector has to wade through to find what is still live, and stage 6's later lessons on collectors and their logs are where that bill actually gets read. This lesson is about the one thing that can make the bill never arrive at all: not needing to have allocated in the first place.
Proving nobody is watching
Escape analysis is the compiler answering one question about an object: can anything outside the method that created it ever observe it? If a Point is created, its two int fields are read to compute a sum, and the reference is discarded when the method returns, the answer is no. Nothing stored it in a field. Nothing returned it. Nothing handed it to a method the compiler could not see into. The object's entire life is bounded by a stretch of code the compiler can read in full, which means the compiler is free to represent that object however it likes, since no other code exists that could tell the difference.
Scalar replacement is what the compiler does with that freedom. Instead of allocating a Point with a header and two int fields packed behind it, the just-in-time compiler keeps x and y as two ordinary values, the kind that live in registers or on the stack, exactly as if the method had been written to take two int parameters instead of one Point. Every place the source code reads p.x() or p.y() becomes a read of one of those two values directly. The record's identity, its header, its very existence as a heap object, is not there to inspect, because it was never built. This is not a smaller allocation or a faster allocation. It is the deletion of the allocation, in full, by a compiler that proved it could get away with it.
Nothing about this changes what the program prints. p.x() + p.y() computes the same sum whether p is a real object on the heap or two scalars the compiler is tracking on its behalf. Escape analysis and scalar replacement are optimisations in the strict sense: they change how a result is produced without changing the result. That is exactly why they are safe for the compiler to apply without asking anyone, and exactly why a reader cannot tell from the printed output whether it happened.
The measurement, and the one line that undoes it
Two methods do identical arithmetic on a record. Both create a Point, both compute a value from its fields, and the two methods differ by exactly one line: the second one stores the record into a field before returning.
record Point(int x, int y) {
    int sum() {
        return x + y;
    }
}

static int noEscape(int x, int y) {
    Point p = new Point(x, y);
    return p.sum();
}

static Point lastSeen;

static int escapes(int x, int y) {
    Point p = new Point(x, y);
    lastSeen = p;          // the one line that changes everything
    return p.sum();
}
In noEscape, the reference to p never leaves the method: it is read from and then discarded. In escapes, the store into lastSeen makes p reachable from a static field after the method returns, which means some other thread, some other method, or a debugger attached later could observe it. That single assignment is the entire difference between the two methods, and it is enough to change what the compiler is allowed to do.
Measured on one machine, with this exact workload, the two methods land in different worlds:
| Method | Time | Allocation |
|---|---|---|
noEscape | 0.597 ns/op | effectively zero, reported as about 10 to the minus 5 bytes per operation |
escapes | 2.878 ns/op | 24.000 bytes per operation |
noEscape allocates nothing at all. The 10^-5 bytes per operation is not a small allocation, it is measurement noise around a true value of zero: no Point was built, so there was nothing to allocate. escapes allocates the full object every single call, exactly the 24 bytes lesson 37 measured for this record with default object headers, because a real Point now has to exist on the heap for that field store to point at. The time follows the allocation: escapes is about 4.8 times slower, and that ratio, not the two absolute numbers, is what should travel to different hardware. A reader running the same comparison on a different machine will see different nanosecond figures and the same shape: the version that cannot escape is dramatically cheaper, because it was never really there.
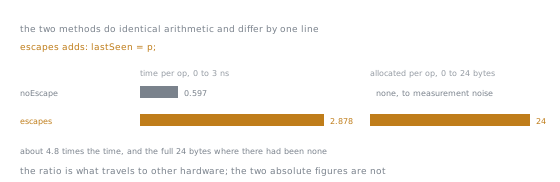
The two measurements are in different units, so they are two scales rather than one axis, but they move together and for the same reason. The empty right-hand cell on the first row is the whole of escape analysis: not a smaller object, no object.
It is worth sitting with how small the source difference is against how large the runtime difference is. Nothing about the arithmetic changed. Nothing about the record changed. One assignment turned an object that did not need to exist into a real, header-bearing, eventually-collected one: about 4.8 times the time per operation, and the full 24 bytes of allocation that lesson 37 measured for this record, where a moment earlier there had been none at all. This is the entire argument for caring about escape analysis: not because it is exotic, but because the distance between "optimised away" and "the full cost" is exactly one line, and the line does not announce itself as special.
What defeats it
Escape analysis only succeeds when the compiler can see the object's entire reachable lifetime and prove nothing outside that lifetime holds it. Several ordinary things make that proof impossible:
- Storing the reference into a field, instance or static, the way
escapesdoes above. Anything that can read that field later, including another thread, can now observe the object. - Returning the reference from the method. The caller now has it, and the compiler generally cannot see every caller to prove none of them retain it.
- Passing it to a method the compiler does not inline. Escape analysis works within what the compiler can see in one pass; a call across a boundary it does not inline is a boundary it cannot see past, so it has to assume the worst about what happens to the reference on the other side.
- Putting it in a collection. An
ArrayList.add(p)is a call to code the compiler is very unlikely to see through, and the list itself is exactly the kind of thing designed to keep a reference reachable well past the method that inserted it.
The reader does not need to memorise this list so much as internalise the one question it is answering every time: can anything outside this method observe this object? If the honest answer is no, the object is a candidate for disappearing. If the honest answer is yes, or even "possibly, depending on what that other method does", the object is going to be built, header and all, because the compiler cannot prove otherwise and it does not gamble on correctness to save an allocation.
Why you must not rely on it
None of this is a guarantee, and treating it as one is the mistake this lesson exists to prevent. Escape analysis and scalar replacement are compiler optimisations, not specified behaviour: nothing in the language or the platform promises that a non-escaping allocation will be removed, on this release or the next one. Whether it fires depends on whether the method carrying the allocation gets compiled by the tier of the just-in-time compiler that performs this analysis at all, which in turn depends on how hot the method is judged to be, which depends on how the rest of the program happens to be running that day. It depends on inlining decisions, and inlining decisions are themselves sensitive to method size, call-site frequency and what else is competing for the compiler's attention. Change something that looks unrelated, such as adding a logging call inside the method, growing it past the size the compiler is willing to inline at a call site, or moving the allocation into a helper that now gets called from a second, colder place, and the same source-level shape that used to scalar-replace cleanly can stop doing so with no warning, no error and no change to the printed output. The program still computes the same answer. It just costs 4.8 times more to get there, silently, because the one thing that was making it cheap quietly stopped happening.
The rule that follows is not "avoid anything that might defeat escape analysis", which would mean writing worse code to protect an optimisation you cannot see and cannot verify without measuring. The rule is the other way round: write the clear code first, the one that returns the value, stores the reference where the design actually needs it, and reads well to the next person. If a profile later proves that a specific allocation is actually your cost, the fix is to remove the allocation from the design, the way the fixes in this stage's own workload later do, rather than to restructure the method hoping the compiler will notice and delete it for you. Escape analysis is a reason not to panic about small, contained objects that never leave a method. It is not a substitute for removing an allocation you have actually measured and found expensive.
How you would actually know
Reading the source and reasoning about escape analysis, the way this lesson has just walked through it, tells you what is plausible. It does not tell you what happened on a specific run of a specific build on a specific machine, because that depends on compiler decisions the source code does not record. The way to settle it is to measure allocation directly, in bytes per operation, the same unit the table above used: a method that scalar-replaced cleanly measures at effectively zero bytes per operation, and a method that did not measures the full size of the object it built. A later lesson in this stage owns the harness for taking that measurement properly; for now, the fact worth keeping is that "did this allocate" is a question with a measured answer, not a guessed one.
Practice
- ▢ A method builds a
Point, callsp.sum(), and returns theint. Nothing else touchesp. Predict whether this is a plausible candidate for scalar replacement, and say exactly what evidence would confirm it rather than merely suggest it.
Check
It is a plausible candidate: the reference is created, read from once, and discarded, with nothing outside the method able to observe it, which is exactly the shape noEscape had above. "Plausible" is as far as reading the code can take you, though. Confirming it requires measuring bytes per operation for that method and seeing a figure near zero rather than near the object's real size; reasoning about the source tells you the compiler is allowed to remove the allocation, not that it did.
- ▢ A method builds a
Pointand callsresults.add(p)on anArrayList<Point>declared outside the method, then returns nothing. Does thisPointescape, and which specific trigger from the list above applies?
Hint
Ask the mental-test question directly: after this method returns, can anything reach p through results?
Check
Yes, it escapes. results outlives the method call, add is very unlikely to be a call the compiler inlines and sees all the way through, and anything that later iterates results can reach this exact Point. This is the "putting it in a collection" trigger: the collection is designed to keep the reference reachable well past the call that inserted it, so the compiler has no basis for proving the object is unobservable once the method returns.
- ▢ Two methods have identical logic. One calls a three-line private helper that the compiler is highly likely to inline. The other calls a large, rarely-used helper from a separate class that is unlikely to be inlined. Both helpers only read the fields of a locally created record and never store or return the reference. Why can the first method scalar-replace with more confidence than the second, even though neither helper actually lets the reference escape?
Check
Escape analysis can only reason about what it can see, and inlining is what lets it see into a call. When the small helper is inlined, its body becomes part of the method the compiler is analysing, so the analysis can follow the reference all the way through and confirm it never escapes. When the large helper is not inlined, the compiler is looking at an opaque call it cannot see past, and since it cannot prove the callee does not stash the reference somewhere, it has to assume the pessimistic case and build the object for real. The two methods can behave identically at the source level and still get different treatment, because the difference lives in a compiler decision, not in anything the reader can see by comparing the two call sites.
- ▢ A colleague adds one line to a hot method, a call to a logging framework passing the locally created object so the log message can print one of its fields, and reports that throughput on that path dropped noticeably with no other change. Using this lesson, explain the most likely mechanism, and what you would check to confirm it rather than assume it.
Check
Passing the object into the logging call is very likely to be a call the compiler does not inline, which is exactly the "passing it to a method that does not get inlined" trigger: the reference now reaches code the compiler cannot see through, so it can no longer prove the object stays unobserved, and the allocation that used to be scalar-replaced away has to actually happen on every call. The way to confirm this rather than assume it is to measure bytes per operation for the method before and after the logging line was added; a jump from near zero to the object's real size is the allocation reappearing, and that measurement is stronger evidence than the throughput drop alone, which could in principle have other causes.
- ▢ Someone proposes deciding whether a method's allocation was optimised away by reading the compiled bytecode with
javapand looking for anewinstruction. Explain why that check answers the wrong question.
Check
javap shows bytecode, which is what the interpreter and the earliest tier of compilation run; the new instruction is there because the source says new Point(...), and it will be there regardless of what the just-in-time compiler later decides. Escape analysis and scalar replacement happen inside the just-in-time compiler, well after bytecode is fixed, when a hot method gets compiled by the tier that performs this analysis, and nothing about that later decision is visible in the bytecode at all. The only check that answers "did the allocation actually happen on this run" is a measurement of bytes allocated per operation while the method is actually running hot, not an inspection of a form of the code that predates the optimisation entirely.
Real-world reps
- [ ] Find one method in code you maintain that constructs a small object purely to read from it once, with the reference never returned, stored, or handed to an unfamiliar call. Apply the mental test out loud: can anything outside this method observe this object? Decide whether it is a plausible scalar-replacement candidate before you would ever consider it a cost worth removing.
- [ ] Take that same method and add exactly one line that stores the object's reference into a field, the way
escapesdoes above. Reread the method and name precisely why that one line, and nothing else about the code, is what would force the object to exist for real. - [ ] Look for a hot path in your own code where a small, locally created object is passed into a call two or three layers deep, such as a logging or metrics call. Note that you cannot tell by reading alone whether that call gets inlined, and that this uncertainty is exactly why the escape question there needs measurement rather than inspection.
- [ ] Skim recent history for a change that added one apparently harmless line, a log statement, a null check, a metrics increment, to a method that runs often, and consider whether it could plausibly have changed an inlining or escape decision rather than the algorithm, the next time that method's performance is questioned.
- [ ] Tomorrow: pick one allocation in your code that you currently believe "probably gets optimised away", and write down in one sentence exactly what you would need to measure to know that rather than believe it.
Going further
- The Garbage Collection Handbook: the theory behind why every allocation is a future tracing or copying cost, which is the half of "allocation is cheap" that this lesson insists on keeping
- JEP 519, Compact Object Headers: the source of the 24-byte figure this lesson borrows from lesson 37 for the escaping
Point - The runtime: the stage 6 reference sheet
- Resources
Not landing? Reread the primary source at the top, since this lesson compresses it and compression is where understanding leaks. Check the glossary for any term that felt slippery.
If the lesson itself is unclear rather than the material, that is a defect: open an issue.