Lesson 40. Reading a Garbage Collection Log
Mission link: Owning a Java service in production means someone will eventually blame the garbage collector for a slowdown, and the only way to settle that argument without guessing is to read the log the collector already wrote.
Primary source: The java Command, Oracle
Prerequisites: Lesson 39, Lesson 36
Warm-up
Lesson 36 distinguished the young generation, where most objects die, from the old generation, where survivors get promoted, and Lesson 39 added that a G1 collection's cost tracks how much survives an evacuation, not how much space exists to search. If a program's objects are almost all short-lived, which kind of collection would you expect to dominate a log of its garbage collection activity: young collections, or the full collections that sweep the whole heap?
Check
Young collections, and by a wide margin. A program whose objects die young keeps the old generation close to empty, and a full collection only has a reason to run when the old generation has accumulated enough survivors to be worth sweeping, so a program that does not promote much starves full collections of anything to trigger them. The log this lesson reads is exactly that shape: sixty collections recorded, and every single one a young one.
Know this
Turning the collector's silence into text
A collector that is doing its job produces no output at all by default, which is exactly the problem: silence and "no problem" look identical until you ask the JVM to say what it did. Unified logging, entered through the -Xlog flag, is that ask. -Xlog:gc is the narrow view, one line per collection, and it is the view this lesson spends most of its time on. -Xlog:gc* is the wide view, every tag the garbage collector subsystem can emit, heap regions, concurrent phases, per-thread timing, and it is worth reaching for once the narrow view has told you there is something to chase, not before. Either can be pointed at a file instead of the console with file=, which is what you want for anything that runs longer than you intend to watch it. The exact form used to produce the log this lesson reads was -Xlog:gc:file=gc.log:time,uptime,level,tags, and each of those four words after the second colon is a decorator, a piece of context -Xlog prepends to every line it writes: time is a wall-clock timestamp, uptime is seconds since the JVM started, level is the line's severity, info for an ordinary collection report, and tags names the logging component that produced the line, gc here. None of the four decorators is optional in the sense that leaving them off breaks anything, but a log with no timestamp and no elapsed time attached to each line is a log you cannot do arithmetic on later, which is most of what this lesson is about to do.
Anatomy of one line
The workload behind this log is a small program that parses log lines like 2026-09-02T10:15:31.482Z | WARN | orders-service | request 8123 completed in 417 ms, splits each one, and counts occurrences by severity, run over 200000 lines for 40 rounds with -Xmx512m. Its garbage collection log opens with one line that is not a collection at all, and then the collections themselves start:
[2026-09-02T11:09:00.355+0000][0.004s][info][gc] Using G1
[2026-09-02T11:09:00.445+0000][0.094s][info][gc] GC(0) Pause Young (Normal) (G1 Evacuation Pause) 49M->6M(258M) 2.266ms
[2026-09-02T11:09:00.503+0000][0.152s][info][gc] GC(1) Pause Young (Normal) (G1 Evacuation Pause) 114M->15M(258M) 3.946ms
[2026-09-02T11:09:00.560+0000][0.209s][info][gc] GC(2) Pause Young (Normal) (G1 Evacuation Pause) 148M->25M(258M) 6.484ms
The bracketed prefix on each line is the four decorators asked for, in the order asked for: a timestamp with its timezone offset, seconds of uptime, the level, the tag. Using G1 is the JVM announcing which collector it ergonomically picked, once, before any collection has happened, and it is not itself a collection to analyse. Everything after it follows one shape. GC(0) is a sequence number, a counter this JVM increments once per collection and never resets or reuses, so GC(1) is guaranteed to be the collection that happened after GC(0) regardless of how much log sits between them. Pause Young (Normal) is the pause kind, a young generation collection of the ordinary sort, as opposed to one that also starts a concurrent marking cycle or one that falls back to a full heap sweep. (G1 Evacuation Pause) is the cause, the reason this particular pause happened, which for an ordinary young collection is always that the young generation filled up and had to be evacuated. 49M->6M(258M) is occupancy: 49 megabytes in use immediately before the pause, 6 megabytes still live immediately after it, and 258 megabytes currently committed, the heap G1 is actually holding right now. 2.266ms is the pause duration, how long every application thread was stopped for this one collection. Read that occupancy figure carefully: 258M is not -Xmx. This run's flag set a ceiling of -Xmx512m, and G1 had only committed 258 megabytes when these three collections ran, comfortably under that ceiling; committed heap is what the collector is using at this moment and can grow toward the ceiling as demand requires or shrink back down, while -Xmx is a promise about the largest it is ever allowed to grow to. Confusing the two is an easy way to misread a perfectly healthy log as one running close to its limit when it is not.
What the whole log says, not what one line says
Reading a single line teaches you the format. Reading the whole log is the actual skill, and it means totalling across every line rather than reacting to the shape of any one of them. This log has 61 lines: the one Using G1 announcement, then GC(0) through GC(59), sixty collections in total. Every one of those sixty reads Pause Young (Normal) (G1 Evacuation Pause), exactly like the three shown above; not one line in the whole log reads Pause Full, and not one mentions a humongous allocation. Summed across all sixty, the pauses total 44.2 ms, for a mean of 0.74 ms per collection, well inside the range the three examples above already suggested. The workload that produced this log took 7441 ms of wall-clock time to parse 200000 lines for 40 rounds. Divide the two: 44.2 divided by 7441 is a little under six thousandths, which is 0.6 per cent of the run's wall-clock time spent with every thread stopped for collection.
The verdict that fraction supports
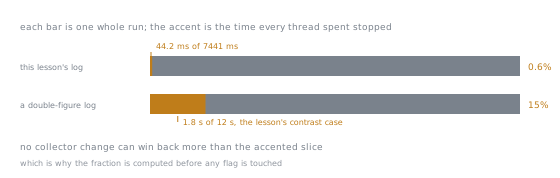
Compute that fraction first, every time, before touching a single collector flag, because it is the number that decides whether the rest of the conversation is worth having.
The upper bound is the width of that sliver. Reading about region sizing would be an argument about the accented piece in the first bar, conducted while the rest of it goes unexamined; the second bar is what a log looks like when the same argument is worth having. At 0.6 per cent, the verdict is plain: the collector is not this program's problem. That is not a hedge, it is an upper bound: since collection consumed 0.6 per cent of the run's wall-clock time in total, no change to the collector, however well reasoned, however successful, can win back more than that same 0.6 per cent, because that is the entire size of the slice it is cutting from. A programmer who wants to make this workload faster and starts by reading about G1 region sizing or pause-time goals is optimising a rounding error while the actual cost sits somewhere else, most likely in what the earlier stage 6 lessons already found for this exact workload, a regular expression compiled fresh on every line. A log usually delivers this verdict. Most programs, most of the time, are not bottlenecked on garbage collection, and a log that says so, in a single division sum, is doing you the favour of ending an unproductive line of investigation before it starts. The interesting cases, the ones worth the rest of this lesson, are the logs that say something else.
What the absence of things tells you
A log is not only the lines it contains, it is also the lines it does not, and reading for what is missing is a habit worth building deliberately. No full collection anywhere in sixty entries means nothing was promoted into the old generation faster than the young generation's own cycle could reclaim it: this program's objects, the split strings, the boxed counters, the intermediate arrays a regular expression split produces, are dying young, almost all of them, so the old generation never accumulates enough to be worth G1's expensive whole-heap fallback. No humongous allocation anywhere means no single object this program allocated, not even a large one built while parsing a 200000-line file, approached G1's threshold for special handling, which is an object at least half a region's size; objects that size cannot go through the ordinary young allocation path and G1 flags them with their own distinct cause when they occur, a flag that never appears in this log because nothing this program built was ever that large on its own. Neither absence is something the log states outright. Both are read by noticing what a category of line, present in principle, contributed zero entries to the total, and that is exactly the discipline: before asking what happened, ask what did not.
What the other verdicts would look like
None of what follows happened in the log above; it is what a different verdict would look like if it had, so that the shape is recognisable the day a log actually shows it. Repeated full collections, Pause Full recurring instead of Pause Young, each one long and each one reducing occupancy by only a little, is promotion pressure: objects are surviving into the old generation faster than anything there reclaims them, so G1 keeps falling back to its slowest, most expensive collection as a last resort. The class of cause is a heap sized too small for the program's actual live set, or a workload promoting more than its shape suggests it should, and the fix that follows is a heap-sizing decision, made from what the log's own occupancy numbers show, not a change of collector, which is Lesson 39's territory and not this one's. A steadily climbing after-figure across the whole log, occupancy that never returns to something like its earlier baseline even though every individual collection is an ordinary young one, is a growing live set: something is being retained that a young collection correctly leaves alone because it is still reachable, and the fix is a question about what the program holds onto and why, Lesson 36's territory of memory areas rather than a garbage collection setting at all. A pause fraction in double figures, ten per cent or more of wall-clock time spent stopped, is the case this lesson's own log did not produce: here, unlike here, spending time on the collector is not wasted effort, because the number itself says there is real time on the table, and sizing the heap or the generation split from the log's evidence becomes a legitimate next move rather than a guess.
Where a log like this points next
When the log's verdict is "the collector is not the problem", that verdict does not tell you where the actual cost is, only that you should stop looking here. This workload's own log is a case in point: 0.6 per cent of wall-clock time went to collection, and the other 99.4 per cent went somewhere the collector will never mention, because a garbage collection log only ever reports on collections. Finding what fills the other 99.4 per cent needs a different instrument, one that samples the running program rather than the collector, and that instrument is Lesson 42's subject. What this lesson hands off is narrower and more disciplined than it might sound: the arithmetic that rules the collector in or out, so that whatever comes next is spent looking in a place a number, not a hunch, said was worth looking.
Practice
- ▢ Using the line
GC(1) Pause Young (Normal) (G1 Evacuation Pause) 114M->15M(258M) 3.946ms, predict what each of the four numeric figures means before checking, and say which one you would never mistake for the value passed to-Xmx.
Check
114M is occupancy immediately before this pause began, 15M is what was still live immediately after it, 258M is what G1 currently has committed, and 3.946ms is how long every thread was stopped. The one to never mistake for -Xmx is 258M: -Xmx is a ceiling fixed once at JVM start, this run's was 512m, while 258M is a live figure describing what G1 happens to be using right now, which can sit well under the ceiling, exactly as it does here.
- ▢ A different log reports a total pause time of 1.8 seconds over a 12-second run. Predict the verdict before computing anything, then compute the fraction and say what it changes about this lesson's conclusion.
Check
1.8 divided by 12 is 15 per cent, a double-figure pause fraction, unlike the 0.6 per cent this lesson's own log produced. Here, unlike there, time spent on the collector or the heap size is not a wasted conversation, because the number itself says fifteen per cent of the run's wall-clock time is available to win back, which is a real ceiling worth pursuing rather than a rounding error.
- ▢ A log for a different service shows sixty consecutive
Pause Young (Normal) (G1 Evacuation Pause)lines, but the after-occupancy figure across those sixty lines climbs steadily from 40M up past 300M and never drops back toward its earlier values. Predict what this shape means, and say which earlier lesson's territory the actual fix lives in.
Hint
Every one of those sixty collections is still an ordinary young collection, nothing has fallen back to a full sweep, so the answer is not about the collector working incorrectly.
Check
This is a growing live set: each young collection is doing its job correctly, reclaiming what has genuinely died, but whatever survives keeps climbing instead of settling near a baseline, which means something is being retained that should not be. That is not a collector problem, and no collector flag touches it; it is Lesson 36's territory, the question of what the program is holding a reference to and why, and finding the answer means looking at the program's own references, not its garbage collection settings.
- ▢ A program allocates one 300 megabyte array while running with
-Xmx512mand G1's default region size. Predict whether the pause that follows will be logged with the same cause you saw in this lesson's log, and say why.
Check
No. G1 treats any single object at least half a region's size as a special case it cannot place through the ordinary young allocation path, and logs the pause that handles it with a cause naming the humongous allocation rather than the ordinary evacuation cause this lesson's log showed sixty times over. The exact wording of that cause is a detail the log will show you when it happens rather than one worth memorising in advance.
- ▢ A teammate reads this lesson's sixty-collection log and proposes switching G1 to a larger region size, reasoning that fewer, bigger regions would speed up collection. Predict whether the log supports spending time on that change, and say what number should end the conversation before the merits of region size are even discussed.
Check
No, the log does not support it. Total pause time across the whole log was 44.2 ms against a 7441 ms run, 0.6 per cent, so no change to region size, however well reasoned, can recover more than that same 0.6 per cent, because that is the entire size of what collection was costing in the first place. The number that should end the conversation is that fraction itself, computed before any specific tuning idea is entertained, which is exactly the habit this lesson exists to install.
Real-world reps
- [ ] Add
-Xlog:gc:file=gc.log:time,uptime,level,tagsto the startup of a service you can run, under whatever load you can generate, and compute the percentage of wall-clock time it spent collecting. - [ ] Open any garbage collection log you already have access to and read it first for what kind of collection never appears in it at all, before reading it for what does.
- [ ] Find a place where your team has already set a garbage-collection-related flag, and check whether a log was pulled and read before that flag was chosen, or only afterwards to see if it helped.
- [ ] Take the arithmetic from this lesson's log, 44.2 divided by 7441, and redo it for the last incident where someone blamed "GC pauses" for a slow service, using whatever numbers that incident's own log actually supplies.
- [ ] Tomorrow: run
-Xlog:gc*for a short interval against a Java process you have permission to attach flags to, and find one tag in its output that never appears in the plaingcview.
Going further
- The java Command, Oracle: the full
-Xlogtag, output and decorator syntax, of which this lesson uses one small, useful slice - HotSpot Virtual Machine Garbage Collection Tuning Guide, Oracle: the reasoning this lesson's verdict is built on
- JEP 158: Unified JVM Logging: the mechanism
-Xlogis the interface to - The runtime: the stage 6 reference sheet
- Resources
Not landing? Reread the primary source at the top, since this lesson compresses it and compression is where understanding leaks. Check the glossary for any term that felt slippery.
If the lesson itself is unclear rather than the material, that is a defect: open an issue.