Lesson 41. A Benchmark You Can Trust
Mission link: A service in production eventually gets a change that someone claims made it faster, and the only way to own that claim rather than merely repeat it is a benchmark harness whose numbers survive scrutiny.
Primary source: JMH samples, OpenJDK
Prerequisites: Lesson 33, Lesson 38
Warm-up
- ▢ In lesson 33 you learned that a
provided-scoped dependency sits on the compile classpath but not the runtime classpath, the scope used for something the environment supplies later, such as a servlet container's API or an annotation processor. Suppose you declare a benchmarking library's code-generating annotation processor as aprovideddependency, exactly the way its own documentation shows, and the project compiles cleanly with no warning at all. What could still be missing, and when would you actually discover it?
Check
On JDK 25, having the processor merely present on the classpath is not the same as having it invited to run: the compiler does not run an annotation processor automatically just because its jar is there. Nothing looks wrong at compile time, because nothing is missing from the class files you asked for, only from a resource the processor would otherwise have generated. You discover the gap only when you run the result, it looks for that resource, and it is not there.
Know this
Everything in this stage that measures anything, allocation numbers, garbage collection numbers, timing ratios, rests on one skill: telling a measurement that means something from a number that only looks like one. This lesson is that skill. Get it wrong and every later number in the stage, and every number a colleague hands you for the rest of your career, is just something you chose to believe.
The stopwatch lies, and it lies quietly
The obvious way to time something in Java is two calls to System.nanoTime() around a loop, subtracted. It produces a number, and the number answers a question you did not ask. First, it measures an interpreter warming up: the very first executions of any method run interpreted, slowly, before the JIT has anything worth compiling. Second, once the tiered compiler notices the method is hot, it recompiles it, more than once, at increasing levels of optimisation, and that recompilation happens on a background thread while your loop keeps running, so part of your measured time is spent running code that is being replaced underneath you mid-measurement. Third, if the loop's result is never used for anything, the compiler is free to decide that none of the work needs to happen at all, and your "measurement" times an empty method you did not intend to write. A single nanoTime reading folds all three failure modes into one number with no error bar attached, so there is no way, after the fact, to tell which of the three you actually measured, or whether you measured your own code at all.
Each of those three has a direct answer inside JMH, which is why the rest of this lesson is really about believing that a countermeasure worked rather than hoping it did. Interpreter warm-up is handled by warmup iterations, run before anything is recorded and thrown away on purpose. Compiler recompilation mid-measurement is handled by giving each measurement iteration enough duration that a compilation event is a small fraction of it, and by forking a fresh JVM per configuration so that one benchmark's compiled, profiled state cannot bleed into the next benchmark's numbers. The vanishing result is handled by a rule with no exception: consume every result, covered in full further down this lesson.
What JMH's model actually buys you
A JMH run forks a brand-new JVM per fork, by default more than one, specifically so that one benchmark cannot profile-pollute another: a JVM that has spent its warmup deciding how to optimise implementationA carries none of that decision-making into a separate process measuring implementationB, and a separate process measuring implementationA again on its second fork starts from the same cold state as the first. Inside each fork, warmup iterations run first and are discarded, then measurement iterations run and are recorded, and only the measurement iterations count towards the number you read. You will see both counts and durations vary across the numbers in this lesson, from a single fork with three short iterations up to three forks with five warmup and five measurement iterations of two seconds each, and the difference between those setups is the entire subject of the error-bars section below.
JMH also separates what you measure from how you report it. Average time reports a duration per operation, which is what every ns/op and us/op number in this lesson is, lower being better. Throughput reports operations per unit of time instead, higher being better, and is the more natural way to read a workload that is naturally described as "how many of these can I do per second" rather than "how long does one of these take." Note that this is a different sense of the word from the one lesson 39 used: there, throughput meant the share of the machine's time spent running your program rather than collecting after it, a proportion, whereas here it is a rate of operations. Both senses are standard in their own subject and the collision is unfortunate, so say which you mean when the two subjects meet, which they do the moment you benchmark a change under a collector. Nothing in this stage's workload needed throughput mode, but knowing it exists matters the day your question is phrased the other way round, and mixing the two modes in one comparison is a mistake worth naming once so you never make it: a smaller average time and a smaller throughput number are not the same kind of good.
The trap: a dependency that compiles clean and runs empty
The setup shown in most JMH write-ups declares jmh-generator-annprocess, the annotation processor that turns your @Benchmark-annotated methods into the generated code JMH actually runs, as a provided dependency. That is the natural scope to reach for: provided is exactly the scope lesson 33 taught for an annotation processor, present at compile time, not something the running artifact should have to ship. On JDK 25, that setup builds a jar containing zero benchmarks, with no compile error and no warning anywhere in the build's output. It fails only when you run it:
Exception in thread "main" java.lang.RuntimeException: ERROR: Unable to find the resource: /META-INF/BenchmarkList
The cause was isolated by running the compiler directly rather than through Maven. With the processor sitting on the classpath and nothing else said about it, JDK 25's javac does not run it, and says nothing about not running it, because merely being present on the classpath is not the same as being invoked. Pass -proc:full explicitly, and the same processor runs and produces META-INF/BenchmarkList, the resource JMH's generated main class reads at startup to discover which methods to run. The trap is not a JMH bug and not a JDK 25 regression in the sense of something broken; it is a change in how explicit annotation processing needs to be, and a canonical setup written before that change now silently does nothing on this release.
The fix a reader should write is to stop asking the compiler to discover the processor on its own classpath and instead name it, on the compiler plugin, as a processor path:
<plugin>
  <groupId>org.apache.maven.plugins</groupId>
  <artifactId>maven-compiler-plugin</artifactId>
  <version>3.15.0</version>
  <configuration>
    <annotationProcessorPaths>
      <path>
        <groupId>org.openjdk.jmh</groupId>
        <artifactId>jmh-generator-annprocess</artifactId>
        <version>${jmh.version}</version>
      </path>
    </annotationProcessorPaths>
  </configuration>
</plugin>
Verified directly: with annotationProcessorPaths in place, the shaded jar contains META-INF/BenchmarkList, and the benchmarks run. Notice what changed and what did not. jmh-generator-annprocess can stay off the compiled artifact's own dependency list entirely, or stay at provided scope if you like keeping it visible there for documentation's sake; either way it never needs to ship. What changed is that annotation processing is no longer something that happens because a jar happened to be reachable, it is something the build asks for by name, on purpose, in a place that shows up in a diff. That is the correct shape for the same reason declaring a dependency directly, rather than relying on it arriving transitively, was the correct shape in lesson 33: a build that works because of something nobody wrote down is a build that stops working the day that unwritten thing changes, and the fix in both cases is to write it down. This is a dependency-declaration problem wearing a benchmarking costume, and it is worth remembering that the next time an annotation processor of any kind seems to have stopped running for no visible reason.
Error bars decide whether a run means anything
A JMH score without its error is a rumour. The harness reports both for a reason: the mean tells you where the middle of the samples fell, and the error tells you how much you should trust that the middle means anything. The same benchmark, run with one fork and three short iterations, reported 6.227 ± 16.560 ns/op. Read that literally: the error is nearly three times the mean, so the interval the run actually supports runs from a large negative number to a large positive one. Negative time is nonsense, which is the tell that this run has not converged on anything, not that the benchmark measured something strange. Re-run with two forks and five measurement iterations of two seconds each, the same code reported 6.795 ± 0.017 ns/op. Same benchmark, same machine, and only the second number is small enough relative to its mean to be worth writing down.
The second example matters more, because it shows the error bar changing which conclusion is correct, not just how confident you should be in the same conclusion. A comparison of a regular-expression-based implementation against a version with a precompiled pattern, run with one fork and five iterations, reported 1761.6 ± 500.0 for the original and 1679.2 ± 88.1 for the precompiled version. Read the intervals rather than the means: 1679.2 ± 88.1 spans roughly 1591 to 1767, and that entire range sits inside 1761.6 ± 500.0's range of roughly 1261.6 to 2261.6. The honest reading of that pair is that the run cannot tell the two implementations apart, not that precompiling helped. The same two implementations, benchmarked properly with three forks and five warmup and five measurement iterations of two seconds, reported 1880.3 ± 110.6 against 1662.7 ± 19.2. Those intervals, roughly 1769.7 to 1990.9 against roughly 1643.5 to 1681.9, do not overlap at all, and that pair does support a conclusion: a real improvement of about 13 per cent. Identical code, two opposite conclusions, and the only thing that changed between the runs was whether the error bars were narrow enough to license a conclusion in the first place.
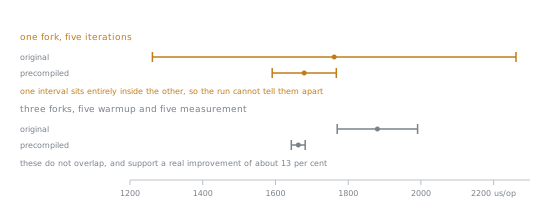
Drawn rather than read, the two runs stop looking like the same kind of evidence. In the top pair the shorter interval is contained by the longer one, so every value the precompiled version might really have is a value the original might really have too. In the bottom pair there is daylight between them, and it is that gap, not the distance between the two dots, that the 13 per cent rests on.
The habit worth taking from both examples is mechanical and cheap: read the error before you read the mean. If the error is a large fraction of the mean, the run has not finished telling you anything, no matter how clean the mean looks in isolation, and the fix is not to squint at the number harder, it is to run longer, with more iterations or more forks, until the error shrinks to where a comparison against it actually means something.
The measurement floor
Below a certain size, you stop measuring your code and start measuring the harness. An empty benchmark method, one that does nothing at all, measured 0.590 ns/op. Four different cheap expressions, a discarded arithmetic expression, a returned one, a constant expression and a field read, all measured somewhere between 0.589 and 0.646 ns/op. Those four numbers are not four different truths about four different expressions; they are the same floor measured four times with slightly different rounding, because at roughly a nanosecond the loop overhead, the timer's own resolution and the call machinery around the benchmark method dominate whatever the method's body actually does. No comparison between two numbers sitting at or near that floor is informative. If two implementations both come back around half a nanosecond to a couple of nanoseconds per operation, the correct response is not to declare a winner, it is to recognise that you are comparing noise to noise.
Consuming results, and the folklore correction
The rule is simple and has no exception worth carving out: every value a benchmark method computes must either be returned from the method, so JMH's generated harness code does something with it, or handed explicitly to a Blackhole. Do neither, and you are trusting the compiler to leave your computation alone for reasons you do not control and cannot see from the source.
The folklore built on top of that rule says the JIT actively deletes work whose result is discarded, dead code elimination, and folds expressions whose inputs are compile-time constants, constant folding, and that this is exactly why the rule exists: without it, your discarded computation vanishes and you measure nothing. Tested directly on JDK 25, with a trustworthy configuration, two forks, five warmup and five measurement iterations of two seconds, neither behaviour reproduced:
| Benchmark | Score |
|---|---|
baseline, empty method | 0.591 ± 0.081 ns/op |
deadCode, calls Math.log(x) and discards the result | 6.795 ± 0.017 ns/op |
liveCode, returns Math.log(x) | 6.876 ± 1.180 ns/op |
foldedConstant, sums a loop bounded by a static final constant | 17.700 ± 0.148 ns/op |
fromField, the same loop bounded by an instance field | 17.795 ± 0.070 ns/op |
Discarding the result of Math.log did not make the call any cheaper: deadCode and liveCode land within each other's error, and both sit well over ten times above the empty-method floor, meaning the call genuinely happened in both cases. Bounding a loop with a static final constant did not beat bounding the same loop with an ordinary instance field either; foldedConstant and fromField also land within each other's error. Teach this honestly rather than repeating the anecdote: the correct lesson is not "the JIT eliminates dead code" or "the JIT does not eliminate dead code," it is that whether either optimisation fires depends on the compiler, the platform and the exact shape of the surrounding code, which makes it unpredictable in both directions at once. You cannot rely on the optimisation happening, and you cannot rely on it not happening either. That unpredictability is the actual reason to consume every result rather than hope: hoping requires guessing which way an implementation detail you do not control will go, on a release you may not have tested it on, and the rule removes the guess entirely.
Two details from that same run are worth carrying forward. JMH auto-detected the mode it would use to keep results alive and said so plainly: Blackhole mode: compiler (auto-detected, use -Djmh.blackhole.autoDetect=false to disable). It warns in the same breath that comparing scores taken under different blackhole modes is not meaningful, which means the moment you see that line differ between two runs you are comparing, the comparison is already compromised before you look at a single mean.
-prof gc, and why bytes beat nanoseconds
Everything above is about extracting a trustworthy time from a system that resists being timed. Allocation does not have that problem. Attach -prof gc and JMH reports bytes allocated per operation, and that number is exact and reproducible in a way no timing figure can be: either an allocation happened or it did not, and the profiler counts bytes, not estimated probability. "Did this allocation happen" is answerable with a yes or no backed by an exact count; "was this faster" is a statistical claim that needs the whole apparatus of forks, warmup and error bars above it before it means anything. That asymmetry is why the allocation profiler, not a stopwatch, produced every number lesson 38 relied on for escape analysis, and why it is worth reaching for first whenever the question in front of you is really about garbage rather than about time.
Two operational details that waste an afternoon each
JMH 1.37 on JDK 25 prints WARNING: A terminally deprecated method in sun.misc.Unsafe has been called, naming sun.misc.Unsafe::objectFieldOffset called from org.openjdk.jmh.util.Utils. That is the harness itself using an API scheduled for removal, the warning mandated by JEP 498, and it says nothing about anything you wrote. Seeing it and assuming your benchmark is broken is the afternoon lost; recognising it as expected noise from the tool, not a defect in your code, is the fix.
JMH formats every score using the platform's default locale. On a machine set to a locale that uses a comma as its decimal separator, a score of 86.412 ns/op prints as 86,412 ns/op, and a reader skimming a report reads that as eighty-six thousand four hundred and twelve, an integer with no unit that makes sense, rather than as roughly 86.4 nanoseconds. Pass -Duser.language=en -Duser.country=US on the command line before running anything you intend to share or paste into a report, and every score prints with a period, removing the ambiguity before anyone has to squint at a number and guess what it means.
Practice
- ▢ Predict what happens, step by step, when a benchmark module declares its annotation processor as a
provideddependency and is built on JDK 25: does the build fail, warn, or succeed, and what happens the first time you try to run a benchmark from the packaged jar?
Check
The build succeeds with no warning at all. The processor never ran, so META-INF/BenchmarkList was never generated and the packaged jar contains zero benchmarks even though every @Benchmark method compiled without complaint. Running the jar throws Exception in thread "main" java.lang.RuntimeException: ERROR: Unable to find the resource: /META-INF/BenchmarkList, which is the only place the failure ever shows up.
- ▢ Two runs of the same benchmark: one reports
6.227 ± 16.560 ns/opfrom one fork and three short iterations, the other reports6.795 ± 0.017 ns/opfrom two forks and five two-second iterations. Which number, if either, would you put in a report, and why?
Check
Only the second. In the first, the error is nearly three times the mean, so the supported interval runs from a large negative number to a large positive one, and negative time is nonsense, meaning the run has not settled on anything worth quoting. The second's error is a small fraction of its mean, narrow enough to support the number as a real reading.
- ▢ A colleague benchmarks a change with one fork and reports
1761.6 ± 500.0for the old code against1679.2 ± 88.1for the new code, and concludes the change made things faster. The same two implementations, benchmarked with three forks, report1880.3 ± 110.6against1662.7 ± 19.2. What should the colleague have concluded from the first run, and what does the second run actually support?
Hint
Compare each interval's full range against the other interval's full range, not just mean against mean.
Check
From the one-fork numbers, "faster" is not supported at all: 1679.2 ± 88.1 spans roughly 1591 to 1767, and that whole range sits inside 1761.6 ± 500.0's range of roughly 1261.6 to 2261.6, so the honest reading is that the run cannot tell the two implementations apart. From the three-fork numbers, the intervals do not overlap, roughly 1769.7 to 1990.9 against roughly 1643.5 to 1681.9, and that pair supports a real improvement of about 13 per cent. The code did not change between the two comparisons; only the run's ability to resolve a difference did.
- ▢ A benchmark method that discards the result of
Math.log(x)and one that returns it both measure close to 6.8 ns/op, well above an empty method's 0.59 ns/op floor. Someone says "the JIT must not be eliminating the dead call here, that's unusual." Is it unusual, and what should you do differently in your own benchmarks because of it?
Check
Not unusual, and not something to build an assumption on in either direction: whether the JIT eliminates work whose result is discarded, or folds an expression over a compile-time constant, depends on the compiler, the platform and the exact shape of the surrounding code, so neither behaviour is something you can predict or rely on. The practical response is to remove the guess entirely by returning every result from a benchmark method, or handing it to a Blackhole, so your measurement never depends on an optimisation you cannot see coming.
- ▢ You benchmark two implementations on a machine set to a locale that uses a comma as its decimal separator, and the report shows
86,412 ns/opfor one of them. Predict what a reader skimming the report will conclude about that number, and name the one JVM argument that avoids the confusion.
Check
A skimming reader reads it as eighty-six thousand four hundred and twelve, an integer, rather than as roughly 86.4 nanoseconds formatted with a comma in place of a decimal point. Running with -Duser.language=en -Duser.country=US formats every score with a period instead, avoiding the misread before it happens.
Real-world reps
- [ ] Set up a Maven module with
jmh-coreandjmh-generator-annprocess, deliberately declare the processor as aprovideddependency, and confirm for yourself that the build succeeds while the packaged jar throws the missing-resource exception the moment you run it. - [ ] Fix that same module with the
annotationProcessorPathsblock from this lesson, rerun the build, and check the shaded jar forMETA-INF/BenchmarkListbefore you run a single benchmark from it. - [ ] Take a benchmark method you write yourself and run it twice with different fork and iteration counts, then compare the two error bars before you let yourself compare the two means.
- [ ] Write one benchmark that discards a result and one that returns it, run both on your own machine, and decide for yourself whether the two scores agree rather than assuming either folklore direction in advance.
- [ ] Tomorrow: attach
-Duser.language=en -Duser.country=USto any JMH command you type, and make it automatic before a comma-decimal locale costs you a misread number in front of someone else.
Going further
- JEP 498, Warn upon Use of Memory-Access Methods in
sun.misc.Unsafe: why JMH's own harness prints a deprecation warning that has nothing to do with your code - Maven Compiler Plugin, Apache Maven: the plugin whose
annotationProcessorPathsconfiguration makes annotation processing explicit instead of implicit - The runtime: the stage 6 reference sheet
- Resources
Not landing? Reread the primary source at the top, since this lesson compresses it and compression is where understanding leaks. Check the glossary for any term that felt slippery.
If the lesson itself is unclear rather than the material, that is a defect: open an issue.