Lesson 42. From Profile to Proof
Mission link: Owning a Java service in production means someone eventually asks you to make it faster, and the honest answer starts with a recording of what it actually did, not a guess dressed up as expertise.
Primary source: Java Flight Recorder API Programmer's Guide, Release 25
Prerequisites: Lesson 41, Lesson 40
Warm-up
Lesson 40 read a garbage collection log and found that 44.2 ms of a 7441 ms run went on collecting, 0.6 per cent. Given only that number, is tuning the collector a promising place to spend an afternoon on this program?
Check
No. Even a perfect collector, one that paused for zero milliseconds, would only speed the run up by that 0.6 per cent, because that is the entire share of wall-clock time the collector was holding. The other 99.4 per cent of the run is doing something else, and that something else is where a real win has to live. The log has already told you where not to look, which is worth exactly as much as being told where to look.
Know this
The workload
The program for this lesson is a log-line indexer, and you build it with nothing you have not already used: a pom.xml, mvn package, and a runnable jar, exactly the machinery from stage 5. It generates its own input, synthetic log lines shaped like this:
2026-09-02T10:15:31.482Z | WARN | orders-service | request 8123 completed in 417 ms
Generating the input yourself matters for two reasons. There is no dataset to fetch, and there is nothing non-deterministic coming from someone else's data, so the run you profile today and the run you profile next week start from the same shape of input. The program loops for a configurable number of rounds, because a profile needs a program that keeps running for tens of seconds, not one that finishes before the profiler has taken its first sample. That also makes this the one stage where a rep can genuinely spill past a single sitting: a recording long enough to be worth reading, followed by a benchmark run with enough iterations to trust, is more wall-clock time than flipping through a reference page, and the workspace's own pacing assumes exactly that for this stage.
Each round parses every line, takes the severity, and counts occurrences by severity. Here is the obvious implementation, the one you start from:
static Map<String, Integer> countByLevel(String[] lines) {
    Map<String, Integer> counts = new HashMap<>();
    for (String line : lines) {
        String[] parts = line.split("\\s*\\|\\s*");
        String level = parts[1].toLowerCase();
        counts.put(level, counts.getOrDefault(level, 0) + 1);
    }
    return counts;
}
Build it, package it, run it with java -jar. It works, it produces the right counts, and every test you would write against it passes. Nothing about reading the method tells you it has a problem. Three allocations per line hide in there: the array split returns, the lower-cased string, and the boxed Integer that getOrDefault and put pass around. You cannot see that from the source. You have to go looking.
Where lesson 40 left you
Lesson 40 ran this exact program, 200000 lines for 40 rounds, under -Xlog:gc, and read the resulting log line by line. The whole run took 7441 ms. Every collection was a young one, sixty of them, and they cost 44.2 ms in total, 0.6 per cent of the run. That is your starting position: the collector is not this program's problem, so whatever is costing the other 99.4 per cent of the time is somewhere else, and a garbage collection log cannot tell you where. It can only tell you where it is not.
Recording
Point Flight Recorder at the same run:
$ java -XX:StartFlightRecording=filename=rec.jfr,settings=profile -jar indexer.jar
StartFlightRecording is a JVM flag, accepted with no separate agent and no extra dependency, because Flight Recorder ships inside the JDK. filename=rec.jfr says where to write the recording. settings=profile selects one of the two built-in configurations that ship with the JDK, default and profile. The default settings sample execution roughly once every 20 ms and lean towards keeping overhead as low as possible for a recording you might leave running indefinitely in production. profile samples more aggressively and turns on more event types, including the allocation sampling this lesson relies on, at the cost of a slightly heavier recording, which is the trade you want for a short, deliberate diagnostic session rather than always-on monitoring. The recording measured on this workload was about 1.0 MB for 8 seconds, which is worth knowing before you start: the cost of finding out is small next to the cost of guessing wrong.
Reading it with the command-line tool
Flight Recorder has a graphical client, Mission Control, but that is a separate download, and you already have a terminal and the jfr tool that ships with the JDK. Start with a summary, which is the recording's table of contents:
$ jfr summary rec.jfr
On this run it reports, among other event types:
 Event Type                              Count  Size (bytes)
=============================================================
 jdk.GCPhaseParallel                     18753        484960
 jdk.ObjectAllocationSample               2280         34723
 jdk.PromoteObjectInNewPLAB               1392         23284
 jdk.ExecutionSample                       630          6919
 jdk.G1GarbageCollection                    61           736
 jdk.GarbageCollection                      61          1232
 jdk.YoungGarbageCollection                 61           736
 jdk.AllocationRequiringGC                   0             0
Two numbers are worth pausing on before you go any further. jdk.GarbageCollection at 61 matches lesson 40's sixty young collections exactly, which is the two tools agreeing about the same run rather than two separate facts. And jdk.AllocationRequiringGC is 0, which means not one allocation in this run had to stall to wait for a collection to make room. Every collection here was G1 keeping up comfortably with a program that allocates a great deal but never outruns the collector. That is one more way of saying what lesson 40 already said: the collector is not struggling.
The two rows worth reading in full are jdk.ExecutionSample, 630 of them, which is where the program's own code was caught standing when the profiler looked, and jdk.ObjectAllocationSample, 2280 of them, which is where allocations were caught happening. Print them:
$ jfr print --events jdk.ExecutionSample rec.jfr
$ jfr print --events jdk.ObjectAllocationSample rec.jfr
Each printed event carries a stack trace, the call chain from the sampled frame back up through your own main. Six hundred and thirty stacks and 2280 more is too many to read one at a time, but it is exactly the kind of thing you can count, and counting them is the verdict.
The verdict
Tally which method names appear in those 630 execution-sample stacks, and the regular expression engine dominates the count:
| Frames counted | Method |
|---|---|
| 502 | java.util.regex.Pattern$BmpCharPropertyGreedy.match |
| 495 | java.util.regex.Pattern.split |
| 479 | java.util.regex.Pattern$Start.match |
| 479 | java.util.regex.Matcher.search |
| 462 | java.util.regex.Matcher.find |
| 104 | java.util.regex.Pattern.compile |
| 83 | java.lang.String.split |
| 54 | indexer.Indexer.countByLevel |
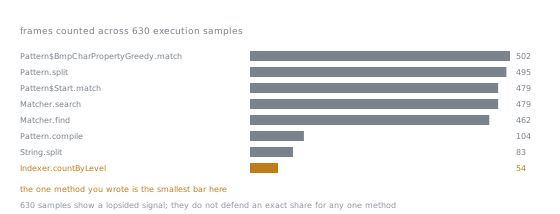
The shape is the point rather than any single count: a wall of library frames, then a gap, then your code at the bottom of it. A reader who arrived here intending to optimise countByLevel would be working on the smallest bar in the picture.
Your own method, countByLevel, appears 54 times. Everything above it in that table belongs to java.util.regex. The allocation samples agree from a different angle: int[] at 668, byte[] at 425, String at 212, java.util.regex.Pattern at 158 and java.util.regex.Matcher at 149, on top of the internal arrays the Pattern engine keeps for its own bookkeeping. Two different sampling mechanisms, one watching the call stack and one watching the allocator, pointing at the same neighbourhood.
The cause is a fact about String.split that the method signature does not advertise: it only takes a fast, allocation-light path when the argument is a single literal character. "\\s*\\|\\s*" is a full regular expression, so every call to line.split(...) compiles that regular expression into a fresh Pattern from scratch, uses it once, and discards it. Two hundred thousand lines means two hundred thousand Pattern objects that live for exactly one line each. Pattern.compile sitting at 104 of the 630 samples is the profiler catching that compilation in the act, repeated on every single line of input.
Sampling and what it can and cannot tell you
A sampling profiler like Flight Recorder does not watch continuously. It interrupts the running program at intervals and asks "what is on the stack right now", and it builds its picture by tallying the answers. That picture is frames weighted by how often they happened to be on a stack at a sampling instant, which correlates with time spent but is not the same thing as time spent, and it is completely blind to anything that happened to fall between two samples. A method that runs constantly for a short burst can be under-sampled by bad luck, and a method that runs briefly but extremely often can be over-represented. Six hundred and thirty samples is enough to see a signal this lopsided, most of the weight sitting in one small cluster of methods, but it is not enough to defend a claim like "Matcher.find is exactly 462 out of 630 of the time", only "Matcher.find was on the stack far more often than your own code was". Read the table above that way: as a strong, repeated signal about where the program spends its attention, not as a stopwatch reading on any one method.
When a table like this one is not decisive enough, or when you need allocation and native frames traced in more detail than sampling gives you, async-profiler is the tool most Java engineers reach for next. It is a separate, actively maintained project rather than something built into the JDK, and it goes deeper into allocation paths and native code than this lesson needs, so it is named here as where to go next, not taught.
The fix, as a hypothesis, and the result
The profile's loudest named frames are the regular expression engine, and Pattern.compile is right there among them, so the obvious first fix is to stop recompiling the pattern on every line: compile it once, as a static final Pattern, and reuse it. That is a real hypothesis, produced directly by the profile, and Lesson 41's harness is what turns "it should be faster" into a number you can trust. Benchmarked over 2000 lines per operation, three forks, five warmup and five measurement iterations of two seconds, with the allocation profiler attached the way Lesson 41 taught:
| Implementation | Time | Allocation |
|---|---|---|
regexSplitPerLine, as written above | 1880.3 ± 110.6 us/op | 2277535 B/op |
precompiledPattern, the same but with a static final Pattern | 1662.7 ± 19.2 us/op | 1061534 B/op |
scanWithoutAllocating, indexOf and a switch on the first character into an int[] | 13.2 ± 3.1 us/op | 40 B/op |
Precompiling the pattern is a real win by Lesson 41's standard, since the two intervals do not overlap: about 1.13 times faster, and about 2.15 times less garbage. That is not nothing, and on a service under load, less garbage produced usually means less collector work too. But look at the third row. Abandoning the regular expression altogether, scanning the line by hand with indexOf to find the field boundaries and a switch on the severity's first character to count into a small int[] instead of a HashMap<String, Integer>, is about 142 times faster than the original, and it allocates 40 bytes per operation instead of 2.28 million, the five-element int[] of counters and nothing else.
State the arithmetic plainly, because it is the entire point of the lesson: fixing exactly the frame the profile named loudest, Pattern.compile, captured about a thirteenth of the win that was actually available. The frames sitting underneath it in the table, Pattern$BmpCharPropertyGreedy.match and Matcher.find, were the real cost, the work of walking the pattern's state machine character by character over every line, and precompiling the pattern does nothing to them. They only disappear when the regular expression itself disappears. A profile is very good at telling you where a program's attention goes. It has no opinion at all about what, if anything, you should do about it. The fix you choose is a hypothesis about the cause, not a fact the profiler handed you, and a hypothesis needs its own measurement before you get to believe it.
The loop
Carry this out of the stage as a discipline, not as a story about one indexer:
- Measure first, so you know whether you have a problem at all and roughly how big it is. This is the step people skip, because it is the one that can tell you to stop. The garbage collection log in Lesson 40 was this step for the collector: it measured 0.6 per cent and closed off a whole line of investigation before it wasted an afternoon.
- Profile to find where, once measurement has told you there is a problem worth chasing. A recording like the one in this lesson turns "the program is slow" into a small, ranked list of named frames.
- Form a hypothesis. The profile names where the time and the allocations go. It does not tell you what change fixes that, and more than one fix is usually possible for the same named frame, as this lesson's own two candidates show.
- Change one thing. Precompile the pattern, or drop it, not both at once, or you will not know which change produced whichever number you see next.
- Benchmark it, with Lesson 41's discipline: enough forks and iterations to get error bars narrow enough to support a conclusion, and the allocation profiler running alongside the clock.
- Keep or revert on the evidence. The precompiled pattern earned its keep here. Had the benchmark come back inside the error bars of the original, the correct move would have been to revert it and go looking underneath, exactly where the second fix in this lesson did.
Practice
- ▢ Predict what
jfr summarywould report forjdk.AllocationRequiringGCon a program that allocates so fast it regularly outruns G1's ability to keep free space ready, and say how that number would look different from this lesson's run.
Check
It would be greater than zero, and would grow with how often the allocator had to stall for the collector to catch up. This lesson's run reported exactly 0 for that event, which is one more way of confirming that G1 was never under real pressure here, consistent with lesson 40's 0.6 per cent collection time.
- ▢ A colleague reads the frame-count table, sees
indexer.Indexer.countByLevelat only 54 out of 630 samples, and concludes their own code is barely worth optimising. Predict what is wrong with that reading.
Hint
Ask what call chain the frames above countByLevel in the table belong to, and who is responsible for those calls happening at all.
Check
Every one of those regular-expression frames exists because countByLevel called line.split(...), so the 502, 495, 479, 479, 462 and 104 counts are all costs their own method is causing, not costs happening to their method from the outside. Counting only the samples where their exact method name appears on top of the stack massively understates their code's true cost, because the cost is mostly hiding one call frame down, in a library method their code chose to invoke.
- ▢ Predict which of the two allocation-heavy resources measured in this lesson,
Patternobjects or boxedIntegercounters, thescanWithoutAllocatingimplementation removes, and which single change removes each.
Check
It removes both. Replacing String.split and its regular expression with indexOf scanning removes the Pattern and Matcher allocations entirely, since no regular expression is compiled or matched at all. Replacing the Map<String, Integer> with an int[] indexed by severity removes the boxed Integer allocations that getOrDefault and put were creating, since a primitive int[] slot never needs to be boxed. Removing only one of the two would still have left the other behind.
- ▢ Predict roughly what the frame-count table would look like if you profiled
scanWithoutAllocatingthe same way this lesson profiledcountByLevel, in terms of which library's frames would dominate.
Check
No java.util.regex frames would appear at all, since nothing in that implementation calls into the regex engine. Whatever frames do dominate would belong to the reader's own method and to String.indexOf, and given how much faster and less allocation-heavy the implementation measured, a profile of comparable length would very likely need to run far longer to collect a comparably sized sample, simply because there is so much less happening per line to be caught mid-flight.
- ▢ The benchmark table shows
precompiledPatternat 1662.7 ± 19.2 us/op againstregexSplitPerLineat 1880.3 ± 110.6 us/op. Using Lesson 41's standard for when two measurements license a conclusion, predict whether this pair supports the claim that precompiling helped, and say why the size of the two error margins matters to the answer.
Check
Yes, it supports the claim: 1662.7 + 19.2 is 1681.9, which is still below 1880.3 − 110.6, 1769.7, so the two intervals do not overlap and the improvement is real rather than noise. The margins matter because Lesson 41 showed the same shape of comparison, regexSplitPerLine against precompiledPattern, produce the opposite, unsupported conclusion under a one-fork, five-iteration run whose error bar swallowed the entire gap: identical code, and only the run with narrow enough error bars gets to claim a result.
Real-world reps
- [ ] Take a service you already run or maintain that has a garbage collection log or a Flight Recorder recording sitting somewhere unread, and read the event summary the way this lesson read one.
- [ ] Pick one method in a project you own that you suspect is slow, but have never actually profiled, and record eight to ten seconds of Flight Recorder data around a workload that exercises it.
- [ ] Take the frame-count table from a recording you have taken and identify which library, if any, dominates it the way
java.util.regexdominated this lesson's table. - [ ] Form one hypothesis about a fix suggested by a profile you have read, implement only that one change, and benchmark it with Lesson 41's discipline before deciding whether to keep it.
- [ ] Tomorrow: run
jfr summaryagainst any.jfrfile you can produce or already have, and read thejdk.AllocationRequiringGCcount against the total allocation sample count, the way this lesson read it as a sign of collector pressure.
Going further
- JDK Flight Recorder documentation, Oracle: the wider diagnostic toolset Flight Recorder belongs to
- async-profiler: a sampling profiler that goes deeper into allocation and native frames than Flight Recorder's default events
- The runtime: the stage 6 reference sheet
- Resources
Not landing? Reread the primary source at the top, since this lesson compresses it and compression is where understanding leaks. Check the glossary for any term that felt slippery.
If the lesson itself is unclear rather than the material, that is a defect: open an issue.