Concurrency and Performance
Lookup sheet for stage 6. The question it exists to answer: is this waiting or computing, and what should I reach for?
All numbers here are from runs on one machine with CPython 3.14.7, a standard build with the interpreter lock present. They are for ratios, not absolutes.
The numbers that decide it
CPU sequential x4                  1.01s
CPU 4 threads                      1.02s      no gain
CPU 4 processes                    0.38s
CPU 4 subinterpreters              0.30s

IO sequential x8 (0.2s each)       1.66s
IO 8 threads                       0.21s      eight-fold
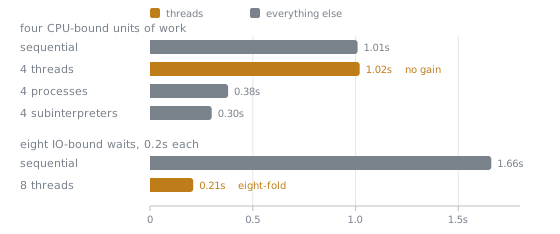
Both accented bars are the same tool. Reading down the chart, threads are the one row that changes verdict between the two groups, which is why "should I use threads" has no answer until the first question is settled.
The lock serialises the interpreter, not the waiting. It is released around sockets, files, sleep, and inside C extensions that opt to release it.
Decision order
- Is it too slow, measured? If not, stop.
- While slow, is it waiting or computing?
- If waiting: how many at once?
- If computing: can the work be split?
| Concurrent waits | Use |
|---|---|
| a handful | sequential |
| up to a few hundred | ThreadPoolExecutor |
| thousands, or long-lived connections | asyncio |
| Computing | Use |
|---|---|
| splittable, plain data | ProcessPoolExecutor |
| splittable, dependencies allow it | InterpreterPoolExecutor |
| the loop can move to a library | NumPy, Polars, the database |
| not splittable | change the algorithm |
Model comparison
| Model | Parallel CPU | Waits | Shares memory | Isolation | Costs |
|---|---|---|---|---|---|
| sequential | no | one | trivially | total | none |
| threads | no | hundreds | yes | none | locks, races |
| subinterpreters | yes | hundreds | no | partial | new; extension support |
| processes | yes | hundreds | no | full | start-up, serialisation |
asyncio | no | tens of thousands | yes, at await | none | colours the codebase |
Thread safety
The lock protects interpreter state, not your invariants. Verified:
check-then-act across a real yield: objects created for one key: 8
same code with a lock:                                           1
a reader saw two fields disagree:                            873 times
Also verified: four threads doing counter += 1 300,000 times each lost zero updates, even with the switch interval at 1 microsecond. The race is real, and whether it is observed is an implementation detail. Do not reason about atomicity from bytecode.
| Safe | Not safe |
|---|---|
list.append, one call into C | d[k] += 1 |
queue.Queue | if k not in d: d[k] = ... |
| returning per-worker results | two fields that must agree |
| immutable shared data | any invariant spanning statements |
Free-threaded builds: sysconfig.get_config_var("Py_GIL_DISABLED") is 1, and sys._is_gil_enabled() is False. Write code that is correct either way, which is the same code.
Threads
with ThreadPoolExecutor(max_workers=8) as pool:
    futures = {pool.submit(work, item): item for item in items}
for future in as_completed(futures):
    future.result()          # or the exception is lost, silently
Every submit needs a result() somewhere. A discarded future is except Exception: pass.
| Primitive | For |
|---|---|
Lock | one holder; a second acquire from the same thread deadlocks |
RLock | reentrant, for a locked method calling a locked method |
Event | shutdown signal, and Event.wait(timeout) for a periodic loop |
Semaphore(n) | at most n concurrent holders |
queue.Queue | the channel; removes the need for a lock |
threading.local | per-thread context; prefer passing it explicitly |
Lock rules: hold briefly, never across I/O if avoidable, always with, one global acquisition order, guard the invariant. Size the pool by the scarcest downstream resource, not by item count.
Shutdown: an Event, not daemon=True, then join(timeout=...). A daemon thread's finally may never run.
Processes
with ProcessPoolExecutor(4) as pool:
    results = list(pool.map(module_level_fn, chunks))
| Crosses the boundary | Does not |
|---|---|
module-level functions, functools.partial of one | lambda, closures, local functions |
| built-in and standard types | files, sockets, connections, locks, generators |
| module-level classes and their instances | classes defined inside a function |
lambda to a process: PicklingError Can't pickle <function <lambda> ...>
Start methods, as of Python 3.14: spawn on Windows and macOS, forkserver on POSIX, and fork is no longer the default anywhere because forking a threaded process is unsafe. Code that relied on inheriting parent memory must pass data explicitly, use an initializer, use shared_memory, or select get_context("fork") deliberately.
Costs measured: a pool of four starts in 0.09s, an interpreter pool in 0.03s; sending a two-million-element list to two processes cost 0.15s against 2 microseconds for len locally. Send few large tasks, and send indexes rather than data.
Subinterpreters isolate module state:
COUNTER bumped in 2 subinterpreters: [1, 1, 2, 2]
parent COUNTER after:               {'n': 0}
asyncio
await in a loop (8 x 0.2s)     1.62s      sequential
asyncio.gather                 0.20s
asyncio.TaskGroup              0.20s
blocking sleep inside async    1.65s      one thread, stalled
asyncio.to_thread              0.21s
await means "suspend until done"; it creates no concurrency. Tasks do.
| Need | Use |
|---|---|
| run a program | asyncio.run(main()) |
| many at once, fail together | asyncio.TaskGroup |
| many at once, tolerate failures | gather(..., return_exceptions=True) |
| a deadline | async with asyncio.timeout(s) |
| a blocking call | await asyncio.to_thread(fn, ...) |
| CPU work | loop.run_in_executor(process_pool, ...) |
| bounded concurrency | asyncio.Semaphore(n) |
| a lock | asyncio.Lock, never threading.Lock |
| per-task context | contextvars |
Rules:
- A
TaskGroupcancels siblings on failure and raises anExceptionGroup, so catch withexcept*. - Never swallow
CancelledError: catch, clean up,raise. - Keep a reference to any
create_taskresult, or it can be collected mid-flight. - An
awaitis as dangerous as a thread switch for an invariant spanning it. Verified: eight concurrent callers of a check-then-act across anawaitproduced 8 builds; with anasyncio.Lock, 1.
Find stalls with PYTHONASYNCIODEBUG=1:
Executing <Task ...> took 0.210 seconds
Profiling
python -m timeit -s "setup" "expression"
python -m cProfile -s cumulative script.py
| Column | Means |
|---|---|
ncalls | call count, often the finding itself |
tottime | time in that function, excluding calls it made |
cumtime | including calls it made |
High cumtime with low tottime means look further down. cProfile measures calls and adds overhead; py-spy and pyinstrument sample, distort less, show waiting, and can attach to a live process. tracemalloc and memray for memory.
timeit reports the minimum, because noise can only slow a run down. Good for comparing implementations, not for predicting production latency.
What is worth optimising
Measured on 3.14:
9999 in list(range(10000))                89.8 usec
9999 in set(range(10000))                 20 nsec        4000x+

slow_count (regex per call, manual dict)  14.4 msec
fast_count (split + Counter)              6.08 msec      2.4x

math.sqrt via attribute, 1000 calls       36.8 usec
sqrt pre-imported to a local              37.8 usec      no gain
append loop, 1000 items                   28.6 usec
list comprehension                        25.4 usec      12%
| Change the work | Change the spelling |
|---|---|
| list membership to a set or dict | hoisting an attribute lookup |
| nested loops to a dict join | comprehension against append loop |
| regex compiled per call to module level | get against try/except |
list.pop(0) to deque.popleft | inlining a small function |
| query per row to one batched query | |
| the loop into NumPy, Polars, the database |
The left column changes complexity class. The right column is folklore measured against an interpreter that no longer exists: do not trade readability for an unmeasured performance claim.
Ceiling on any local optimisation: the fraction of total runtime it occupies. Ten times faster on 3 per cent of the time buys 2.7 per cent.
What concurrency does not fix
| Symptom | Cause |
|---|---|
| a query per row | the query pattern |
| latency from one remote call | that service, or a cache |
| more workers, less throughput | a downstream limit, contention, or memory |
| memory grows with workers | each worker holds its own copy |