Lesson 41. When the Query Is Not the Problem
Mission link: A team that ships an index because one run felt faster has proved nothing, and the same habit of trusting a feeling over a count is what lets a bloated table or a chatty client hide behind "the query" indefinitely.
Primary source: PostgreSQL, 24.1 Routine Vacuuming
Prerequisites: Lesson 29, Lesson 38
Warm-up
- ▢ Lesson 29 showed an
UPDATEwriting a new row version and leaving the old one behind, dead until a laterVACUUMremoves it. If a table's row count never changes but every row is updated once, what happens to the number of row versions the table holds, even thoughcount(*)reports the same figure throughout?
Check
It doubles: every original row is still there, now dead, beside the new version the UPDATE wrote. count(*) only counts live versions, so it reads the same before and after, while the table itself now holds twice as many row versions, which is a size before it is anything else.
Know this
Proving a win, as a method rather than a claim
A win is not a feeling that a query returned quickly; it is a plan captured before a change, the same plan captured after, and one count, not a timing, that moved between the two: capture the plan before, change one thing, capture the plan after, compare a count a rerun of the unchanged query would not move on its own. select count(*) from orders where customer_id = 4242 with no index near customer_id plans as the familiar fallback:
Finalize Aggregate (actual rows=1.00 loops=1)
  Buffers: shared hit=7608
  ->  Gather (actual rows=3.00 loops=1)
        Workers Planned: 2
        Workers Launched: 2
        Buffers: shared hit=7608
        ->  Partial Aggregate (actual rows=1.00 loops=3)
              Buffers: shared hit=7608
              ->  Parallel Seq Scan on orders (actual rows=2.33 loops=3)
                    Filter: (customer_id = 4242)
                    Rows Removed by Filter: 349970
                    Buffers: shared hit=7608
The one thing to change is an index: create index i41_customer_id on orders (customer_id), then analyze orders. The same query now reads:
Aggregate (actual rows=1.00 loops=1)
  Buffers: shared hit=4
  ->  Index Only Scan using i41_customer_id on orders (actual rows=7.00 loops=1)
        Index Cond: (customer_id = 4242)
        Heap Fetches: 7
        Index Searches: 1
        Buffers: shared hit=4
shared hit=7608 fell to shared hit=4, four buffers total: that is the win, stated as a count. Dropping i41_customer_id afterwards returns the next run to the first plan, confirming the number was the index's doing. Buffers are the number to trust because five runs of the unindexed query, nothing changed between them, gave execution times spread by about 4 percent fastest to slowest, while Buffers: shared hit=7608 came back identical every time: a timing is a fact about the machine at that moment, a count is a fact about the work done, and only the count survives being run again on different hardware. When a timing is genuinely what you need, repeat it and report the spread, as that sentence just did, rather than quoting one attempt as a number to match.
The table itself, which is the most common non-query cause
A query can be perfectly planned and still be slow because the table underneath it has grown fat on its own writes. A 200,000-row table sized at 27 MB, with one UPDATE touching every row, grows to 54 MB: pg_stat_user_tables reports n_dead_tup at 200000 against n_live_tup still 200000, and pgstattuple gives it a real percentage, dead_tuple_percent 47.08. A plain VACUUM takes that to dead_tuple_percent 0.0 with free_percent 50.13, and the file is still 54 MB: nothing about the row count changed, only that roughly half the file is now marked reusable rather than occupied, which is not the same as returned. VACUUM FULL is what actually shrinks the file, back to 27 MB. A plain VACUUM cannot, by lesson 29's mechanism: a dead row version is deleted only once nothing can still need it, and returning its space to the operating system means rewriting the whole table into a new file, which is why VACUUM FULL takes an ACCESS EXCLUSIVE lock; doing that safely against a live table is stage 7's subject, not this one.
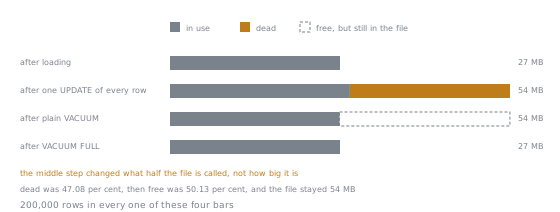
The second and third bars are the same length on purpose, because the file was. Only the name of half of it changed, from dead to free, and a monitoring check that watches file size would have seen the VACUUM do nothing at all.
How to look
Two views answer "is this the table" with nothing to install. pg_stat_user_tables carries n_live_tup, n_dead_tup and last_autovacuum per table, and tracked the same 200,000-row table with no extension at all: n_dead_tup at 0 before the update, 200000 right after, back to 0 once the plain VACUUM ran; a last_autovacuum that is null or old beside a large n_dead_tup says autovacuum has not caught up. pg_stat_all_indexes carries idx_scan per index, which is how you find one worth dropping: three point lookups against a small indexed table left one index's idx_scan at 3 and a second, built on a column nothing had filtered by, at 0, the honest signal that it has cost every write something and paid nothing back. Both are cumulative counters since the last statistics reset, not a per-run number the way a plan's Buffers line is: rerunning a script adds to idx_scan rather than restarting it, so a counter climbing between two checks means activity happened in between, never which run caused it.
The tools that need more than a query
pgstattuple needs only CREATE EXTENSION pgstattuple, and it is what put a real percentage on the dead space above rather than leaving it as "the file grew", worth the extra step over guessing from n_dead_tup alone. pg_stat_statements cannot be demonstrated here: the extension installs cleanly with CREATE EXTENSION pg_stat_statements, but querying the view it creates fails immediately:
ERROR:  pg_stat_statements must be loaded via "shared_preload_libraries"
SQLSTATE: 55000
That is not a misconfiguration to fix in the moment; the module has to be loaded when the server starts, so a session that only just thought to ask for it cannot have the answer this session. What it gives you, once loaded from the start, is a documented view of per-statement totals, calls, time and rows across everything the server has run, the difference between "the database is slow" and "these three statements are", taken here on the documentation's word rather than invented output: see F.32. pg_stat_statements.
The causes that are not the database at all
Three causes produce a slow-feeling application with nothing wrong in any plan, because the problem never reaches the server as one query. The first is the same query run once per row from application code, the client-side shape of what lesson 11 named a correlated subquery: a loop in a client sends the same statement once per row of an earlier result, and no plan shows it, since each statement executes perfectly alone; the evidence is the same short statement, one parameter different, arriving many times in the second it takes to render one page. The second is a connection acquired and dropped per request rather than held and reused, a cost entirely outside any query text, evidenced by a gap between the client asking and the server starting work, since a plan begins only once a connection exists. The third is a full result set fetched when twenty rows were wanted, lesson 40's pagination material seen from the client's side: a correct LIMIT still makes the server build and send every matching row if the client reads the whole cursor first, and the evidence is a row count leaving the server far larger than what the screen showed. None of the three is something this arc fixes; pooling and client tuning are their own subject, and the job here stops at recognising that the next plan does not hold the answer.
What the stage bought
Lesson 35 gave you a plan to read bottom to top and which numbers in it to trust over a cost or a timing. Lesson 36 named the four scan kinds a plan can print and what each costs in buffers. Lesson 37 traced every estimate back to a sample ANALYZE took, and what happens once it goes stale. Lesson 38 turned column order into the deciding fact about what an index can answer. Lesson 39 is where the planner's choice between a hash, a merge and a nested loop stopped being a mystery. Lesson 40 is why OFFSET gets slower the further a reader pages. This lesson adds the last piece, that the plan you read so well is sometimes not where the problem is. What comes after this is operating what you have built, and deciding when SQL is the wrong tool for the job.
Practice
- ▢ You add an index, rerun the query once, and it feels faster. Predict which step of this lesson's procedure you skipped.
Check
Capturing the plan before the change. Without it, "feels faster" has nothing to compare against: a query can feel faster from a warmer cache or a quieter machine, and only a plan-derived count taken both times rules that out.
- ▢ Immediately after a plain
VACUUMon a table just fully updated, predict whatdead_tuple_percentand the file's size each read, and which of the two moved.
Hint
A plain VACUUM clears dead row versions for reuse; ask what "for reuse" means for a file's length.
Check
dead_tuple_percent reads 0.0, and the file is still the size it was right after the update, not the smaller size from before it. Only the occupied marker moved; the file does not shrink until VACUUM FULL rewrites it.
- ▢
pg_stat_all_indexes.idx_scanfor an index reads0. A colleague reruns the same test script a second time before you look again. Predict whetheridx_scanfor that index is still0.
Hint
idx_scan is a cumulative counter, not a per-run figure; what does rerunning the same script do to a counter already at 0?
Check
Still 0, if the rerun genuinely never touches that index: a cumulative counter only grows when the index is used, so a script producing 0 once produces 0 again for the same reason.
- ▢
CREATE EXTENSION pg_stat_statementssucceeds with no error. Predict whetherselect * from pg_stat_statements limit 1now returns rows.
Check
No, it fails with SQLSTATE 55000. Installing the extension only creates the view; the module that populates it has to be loaded through shared_preload_libraries at server start, which a same-session CREATE EXTENSION cannot arrange retroactively.
- ▢ An endpoint feels slow, yet every query behind it, checked with
EXPLAIN (ANALYZE), comes back cheap and well-planned. Logs show the same short statement, one parameter different, arriving hundreds of times in the second it takes the page to load. Predict which non-database cause that evidence points to.
Check
The same query run once per row from application code, the client-side shape of a correlated subquery. A cheap statement run once is not the problem; run hundreds of times because a client loops over an earlier result, it is, and no single EXPLAIN shows that.
- ▢ A page issues a query with
LIMIT 20, whose plan shows exactly 20 rows and a small buffer count, yet the page still takes seconds. Predict a client-side reason consistent with that plan.
Hint
The plan says the server did almost nothing wrong; the mismatch is about what happened to those rows, or how many crossed the wire, after the server returned them.
Check
A full result set fetched when twenty rows were wanted, such as a client reading every row before displaying the first twenty, or an OFFSET paging far into the table first, lesson 40's pagination material seen from the client's side.
Real-world reps
- [ ] Run
pg_stat_user_tablesandpg_stat_all_indexesagainst a table you maintain, and checkn_dead_tupagainstlast_autovacuumand whether any index sits atidx_scan = 0. - [ ] Take a slow query of your own, run
EXPLAIN (ANALYZE)before and after changing one thing about it, and compare the one buffer or row count that answers whether the change helped. - [ ] Tomorrow: pick one endpoint or job you maintain and check which, if any, of this lesson's three client-side causes it has: a query run once per row, a connection opened per request, or a result fetched in full when only a page was used.
Going further
- 24.1.2. Recovering Disk Space: why a plain
VACUUMfrees space without shrinking the file, and whatVACUUM FULLcosts to do it - F.33. pgstattuple: the extension behind the dead-space and free-space percentages above
- F.32. pg_stat_statements: the view this lesson could not demonstrate, and what it reports once loaded
- 27.2.19. pg_stat_all_tables:
n_live_tup,n_dead_tupand the autovacuum timestamps this lesson read - Performance: the stage 6 reference sheet
- Resources
Not landing? Reread the primary source at the top, since this lesson compresses it and compression is where understanding leaks. Check the glossary for any term that felt slippery.
If the lesson itself is unclear rather than the material, that is a defect: open an issue.